
When ASI behaves strangely, the investigation should begin with evidence rather than guesswork.
Advanced Subscriber Intelligence includes a controlled Debug & Diagnostics System for investigating queue, sending, validation, reporting, bounce, service, configuration, and infrastructure problems without turning normal operation into a permanent wall of logs.
Authorised operators can enable the required diagnostic mode, inspect bounded log views, capture environment context, generate redacted support bundles, add investigation notes, and preserve an audit trail of what was reviewed and changed.
Debugging is temporary visibility for a defined problem. It is not a second Truth Engine, a replacement for AOCR, unrestricted support access, or a setting that should be left running because somebody might need it one Thursday.
Read-Only Log Review
Redacted Support Bundles
Auditable Investigation
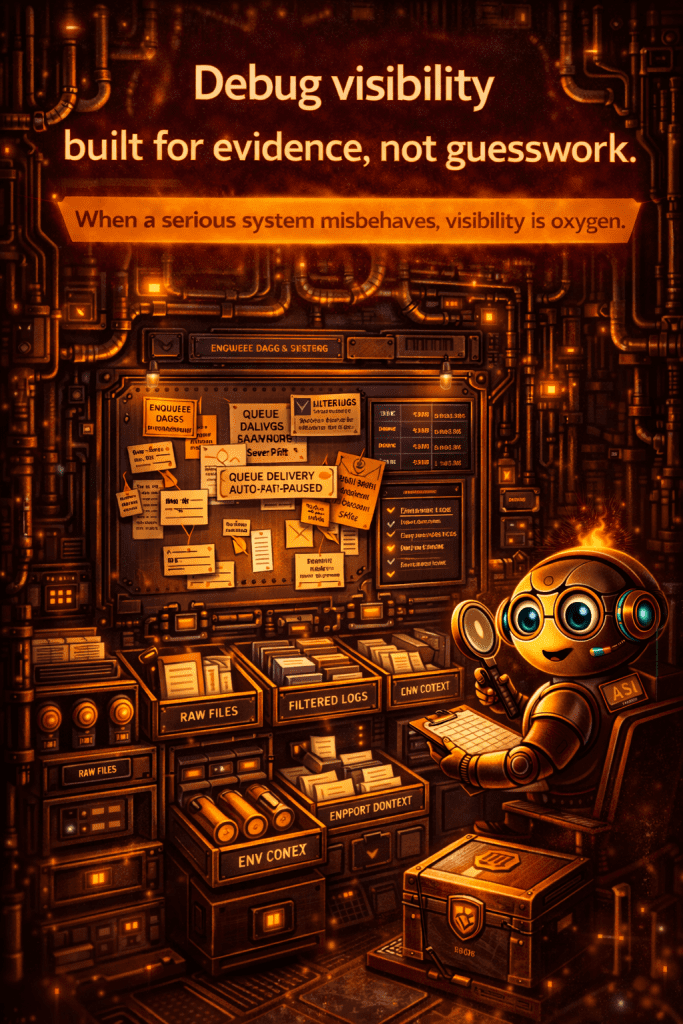
Turn on only the evidence needed, capture the problem, then turn the noise back off.
Diagnostic visibility has a cost. Extra logging can create larger files, expose more operational detail, and distract from the evidence that actually matters. ASI therefore treats debug modes as deliberate, scoped, time-bounded investigation tools.
Why diagnostics matter in a serious sending platform
The platform may be simple for the operator, but the system underneath still has queues, workers, services, providers, databases, reporting rails, and several opportunities to develop an attitude.
Symptoms can be misleading
A campaign page may appear stuck while the real issue sits in a worker, queue state, provider lane, database query, service, or cached display.
Live evidence changes quickly
Queue rows, service conditions, provider responses, and errors may change while support is still asking what happened.
Guessing creates second faults
Changing settings, restarting services, clearing state, or deleting evidence before the cause is understood can turn one fault into a small family business.
Support needs a shared picture
Operators and authorised support staff should be able to review the same captured environment and diagnostic evidence rather than several fading descriptions.
Logs describe what happened. SQL Core remains authoritative.
A log line, cached view, diagnostic summary, support note, or environment snapshot may help explain ASI behaviour. None of them replaces the protected subscriber, campaign, queue, sending, consent, suppression, validation, or reporting truth owned by ASI Core.
SQL truth first
Current subscriber, campaign, queue, event, consent, suppression, bounce, and evidence state remains authoritative in SQL.
Logs add sequence and context
Logs can show which code path, service, query, provider response, request, or operator action surrounded a change.
Snapshots capture a moment
An environment snapshot helps investigation but should never be mistaken for permanently current platform state.
Support notes record interpretation
Notes document what staff concluded, rejected, changed, and verified. They do not silently rewrite the platform’s operational truth.
Enable the right level of visibility for the fault being investigated.
ASI separates diagnostic controls so operators do not need to enable every available log simply because one screen looks suspicious.
ASI application debug
Adds ASI-specific application context for protected workflows, decisions, errors, and diagnostic events.
PHP error logging
Captures PHP warnings, notices, exceptions, fatal errors, and related runtime context when code execution is involved.
SQL diagnostic logging
Supports investigation of selected database queries, exports, failures, timing, and protected data operations without making SQL logging permanent.
Sending and queue context
Adds bounded evidence around campaign movement, queue state, worker activity, Exim handoff, provider lanes, and message processing.
Validation and import context
Supports investigation of file intake, batch state, validation stages, jurisdiction routing, transfer, holds, and worker progress.
Reporting context
Helps trace report contracts, filters, Event Stream rows, PDF generation, exports, recipient drilldown, and evidence-view discrepancies.
Bounce and provider context
Supports review of mailbox responses, bounce parsing, classifications, diagnostics, provider holds, complaints, and recovery behaviour.
Integration and API context
Helps trace authenticated source requests, contract validation, replay protection, Core decisions, returned results, and connector failures.
Inspect the evidence without editing the evidence.
The diagnostics interface provides bounded, read-only views of relevant logs so operators can investigate without accidentally changing or truncating the files they are trying to understand.
Filtered log tails
Review the latest relevant entries without loading an enormous operational file into the browser.
Time and severity filters
Narrow the investigation to the incident period, warning class, error type, campaign, service, or another supported context.
Protected file paths
The interface exposes only approved diagnostic sources rather than allowing arbitrary server-file browsing.
No log editing
Review surfaces do not provide a convenient edit box for making an awkward error disappear from history.
Package the evidence required for support, not the entire client environment.
ASI can generate a local diagnostic support bundle containing the selected logs, environment context, system snapshot, version information, operator notes, and investigation metadata required for the specific issue.
Selected evidence only
The operator chooses the relevant diagnostic categories rather than exporting every available log and record by default.
Environment snapshot
Version, server context, service state, queue summary, relevant settings, recent changes, and operating mode help frame the fault.
Operator notes
The operator can record the symptom, incident time, affected campaign or workflow, steps already taken, and the outcome expected.
Local review before sharing
The bundle is created for review. It is not silently uploaded to ASI merely because the operator clicked Generate.
Useful diagnostics should not require casual exposure of client data.
Support bundles and diagnostic views should minimise or redact sensitive information wherever the investigation can still be completed without it.
Email-address redaction
Subscriber and recipient addresses can be masked where the complete address is not required to explain the fault.
IP and network redaction
Full IP addresses and network identifiers can be reduced or removed where precise values are not required for the investigation.
URL and token protection
Tracking URLs, authentication tokens, API credentials, session data, and other secrets should never travel casually inside a support package.
Purpose-led inclusion
Where unredacted evidence is genuinely required, its inclusion should be deliberate, authorised, and limited to the issue under investigation.
Observe, capture, compare, correct, verify, close.
A controlled investigation preserves the evidence before changing the system and verifies the outcome before declaring victory.
Observe
Define the symptom, affected workflow, incident time, expected behaviour, and business impact.
Capture
Enable the minimum required debug controls and preserve the relevant logs, SQL truth, environment, and timeline.
Compare
Compare current evidence with the expected architecture, previous working state, version history, and related incidents.
Correct
Apply the smallest safe change through the correct authority and protected rail rather than performing unrelated cleanup.
Verify
Repeat the original workflow, confirm SQL and operational state, review side effects, and prove the fault no longer exists.
Close
Disable temporary debug modes, record the cause and outcome, retain required evidence, and remove diagnostic files that no longer have a purpose.
The investigation should leave its own evidence.
Diagnostic access and support actions should remain reviewable so later operators can understand what happened without reconstructing the incident from memory.
Debug state changes
Who enabled or disabled a diagnostic mode, when it changed, and the investigation reason can remain visible.
Bundle creation and preview
The generation, preview, scope, redaction state, and later handling of a diagnostic package can be recorded.
Support actions
Authorised changes, runbook steps, maintenance actions, escalations, and client approvals should leave an accountable trail.
Cause and verification
The confirmed cause, rejected theories, final correction, regression checks, remaining risks, and closure evidence can be preserved.
AOCR finds the pressure. Diagnostics helps explain the fault.
The two systems support different parts of the same operational discipline.
Estate-level awareness
AOCR watches wider service, queue, provider, infrastructure, version, diagnostic, and support signals so ASI can identify which environment deserves attention first.
Environment-level investigation
The diagnostic system provides the bounded logs, state, support bundle, redaction, notes, and investigation controls needed to understand the specific fault.
Remote support is an approved session, not permanent possession of the keys.
Where remote support is used, the design remains client-controlled, purpose-limited, time-bounded, revocable, and auditable. Nothing in the diagnostic system grants ASI unrestricted full administrative access.
Visible client consent
Support access begins through a deliberate approval the client can see and revoke.
One approved purpose
The session is limited to the named fault, environment, diagnostic evidence, and approved support actions.
Time and network boundaries
Access can be limited by session duration, approved source, environment, staff role, and the permissions required for the investigation.
ASI-only maintenance actions
Optional actions remain tightly scoped to approved ASI diagnostics and maintenance rather than providing general server or site administration.
Visibility does not remove the need for restraint.
The diagnostic system is deliberately bounded so troubleshooting cannot quietly bypass ASI architecture, client control, or operational evidence.
Not permanent verbose logging
Diagnostic modes should not remain enabled indefinitely after the investigation purpose has ended.
Not a database editor
Logs and diagnostics do not grant permission to rewrite subscriber, queue, campaign, consent, suppression, or reporting truth.
Not unrestricted server access
The diagnostic interface does not expose arbitrary files, commands, credentials, databases, or administrative functions.
Not permission to improvise
Seeing an error does not authorise an unrelated cleanup, redesign, deletion, or speculative repair without evidence and scope.
A smaller, provable problem.
The symptom is defined, the evidence is captured, the likely cause is narrowed, the correction is bounded, and the result is verified without losing the history required to explain it.
Three new mysteries and a 4GB log file.
Everything is enabled, nothing is scoped, sensitive data is copied around, several settings are changed at once, and nobody can prove which action fixed or worsened the original fault.
Explore the surrounding ASI rails
Continue into ASI Operations Control Room, Sending Engine & Queue Control, Campaign Reports & Insights, Subscriber Validation Pipeline, ASI Integrations, and Enterprise Linux 2027.
A serious platform should be easier to investigate, not harder to question.
Talk to ASI about operational diagnostics, protected log access, redacted support bundles, queue and sending investigations, controlled remote support, AOCR monitoring, and the evidence required to solve faults without weakening client data control.